Introduction to Pixel-Perfect Reports
The Pixel-Perfect Reports Builder enables you to build customizable report templates with precise control over the positioning and style of every element on the layout, down to the individual pixel.
This is important when the output must meet exact specifications, such as in audit reports, tax forms, regulatory documents, shipping labels, and more. This feature also provides rigorous controls for formatting PDF and print output. This feature also includes many of the same developmental features as Dashboards, including Filters, Workflows, Formulas, and its own embeddable widget.
Editor
The editor provides a variety of tools for creating reports: including designing the layout, setting up datasets, and configuring settings. When creating fixed templates, the templates do not contain live data. The Preview or Export feature resolves the values, and the output displays with the complete data using as many pages as needed.
The Toolbar at the top of the page provides a variety of components that you can add to the canvas. On the right side, several configuration panels enable you to configure the report, including its components, datasets, and filters.
![]()
The majority of the interface consists of the canvas, on which the report is designed. By default, reports have two headers, two footers, and a body. They are defined as follows:
- Report Header - Cover page or header that displays only on the first page of the report.
- Page Header - Header that displays on all pages of the report. The Page Header does not display on the cover or back cover, if applicable.
- Body _ Principal section of the report.
- Page Footer - Footer that displays on all pages of the report. The Page Footer does not display on the cover or back cover, if applicable.
- Report Footer - Back cover page or footer that displays only on the last page of the report.
Create a Report
-
Select the Pixel-Perfect Reports icon from the left-side menu to open the Pixel-Perfect Reports dashboard.
-
Select Create New Report. The Name Your Report dialog displays.
-
On the Name Your Report dialog, enter a Name and Description in the fields provided.
-
Select Next. The Page Setup dialog displays.
-
On the Page Setup dialog, select the following options:
- Paper Size
- Units of Measure
- Width
- Height
- Orientation
-
Select Finish. The new report displays in Edit mode, allowing you to design your report.
Note: You can resize the height of the canvas of each report area (Report Header, Page Header, Body, and so on) by dragging their horizontal dividing lines.
Set Up Data and Parameters
The Data and Parameters panel allows you to select the dataset to use in your report and create parameters. You can only select one dataset per report. Parameters can be used to filter data interactively or display information in the report. Parameters are user-defined variables that are only available inside the report.
Select a Dataset
To add a dataset to your report, select the dataset from the Data & Parameters panel in the right-side menu.
![]()
After the dataset is added, the dataset columns display in the panel as Categories and Values. They are now available for use in the report. To view the data from your dataset displayed in the report, you can use Dynamic Tables.
Note: At any time, you can select Preview to preview the report. The Preview feature displays the actual data from your dataset.
Create a Parameter
-
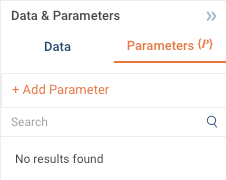
Select the Parameters tab from the Data & Parameters panel.
-
Select Add Parameter. The New Parameter dialog displays.
-
Complete the fields and select Save. For more information about the properties, see Edit a Parameter.
Edit a Parameter
-
Select Edit Parameter from the three-dot menu. The Edit Parameter dialog displays.

-
Enter a unique Parameter Name in the field provided. It cannot use special characters.
-
Enter helpful text in the Parameter Label field. This text displays in the parameter’s preview panel.
-
In the Data Type dropdown, select Numeric, Text, or Date Time.
-
Select whether the parameter is Visible or Hidden. If set to Visible, you will be prompted to provide a value when using the Preview feature. If set to Hidden, you will either need to define a default value or select Allow Null Value.
-
To enable the parameter to accept an empty/null value, select Allow Null Value.
-
To enable the parameter to accept an empty string as a value, select Allow Blank Value. This option is only available for Text parameters.
-
To define a default value, select Specify Default Value. Enter the desired value in the Default Value field.
-
Select Save.
Use Parameters in the Report
Parameters can be used in several ways in the report. They can display information, or they can serve as interactive filters.
To display a parameter value in the Text element:
-
Add a Text element to the report and select
{}.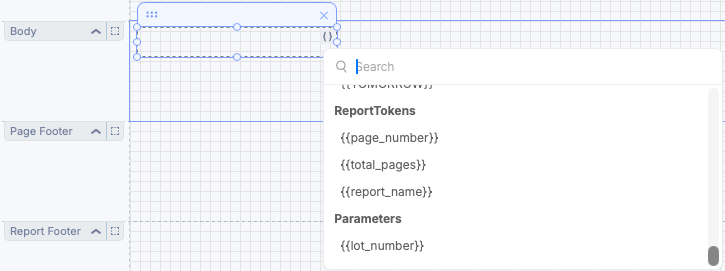
-
Scroll to the bottom of the tokens list and select your parameter from the Parameters section.
-
Preview the report. If you didn’t specify a default value for your parameter, enter it and select Preview Report.
To add an interactive filter:
-
While in Edit mode, add a new filter.
-
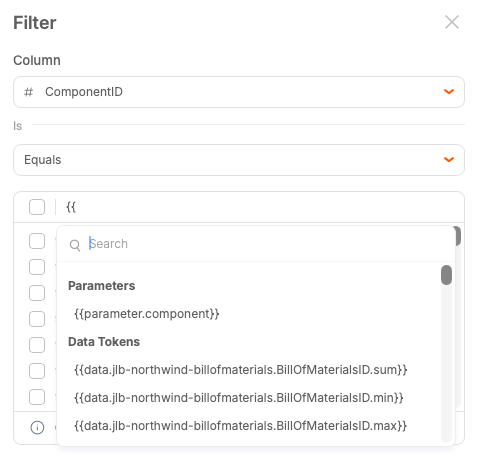
In the Filter window, select a data column to filter by.
-
Start typing
{{in the search field to display the list of tokens. -
Select your parameter, then press Enter to add it to the filter.
-
Apply your changes. The parameter value is now associated with the filter.
-
To apply the filter, enter the filter value in the report preview and select Preview Report.
If you specified the default value, the filter value will be prefilled, but can be changed interactively.
Notes:
- Parameter values are case-sensitive.
- Parameters do not support multiple values.
Using a Report
There are multiple ways in which you can use a report.
Preview Report
The Preview feature enables you to see the report with actual data. It resolves all token values and applies all filters. Use it to verify your configurations. If you defined a Report Group, the report will be divided into separate tabs, one for each distinct value from the associated column.
To preview the report, select the Preview button. If you included parameters in the report, the Parameters panel displays, prompting you to enter values for the parameters before the report can be displayed.
The report displays in its final format. To return to edit mode, select Edit.
Note: Reports are limited to 200 pages and 1000 tabs.
Download Report to PDF
Pixel-Perfect Reports enable you to download completed reports in PDF format. If you defined a Report Group, the report is divided into separate tabs, one for each distinct value from the associated column. You can choose to download a PDF of only the current tab or a ZIP file containing PDFs of all the tabs in the report.
Note: To download reports, your user account must have the Exporting permission, which is configured in Qrvey Admin Center. For more information, see Managing Users.
-
Select the Preview button to display the report with data resolved from the selected dataset column.
If you included parameters in the report, the Parameters panel displays, prompting you to enter values for the parameters before the report can be displayed.
-
To download the tab you are currently viewing, select the Download icon and select Download Report to PDF. The Exports and Subscription dialog allows you to schedule exports and subscribe to them.
-
If you defined a Report Group, you have the option to create PDFs of each tab (downloaded together in a single ZIP file). To download all tabs, select the Download icon and select Download All Reports to PDF. The Download File dialog displays indicating that the file will be exported.
-
On the Export dialog, select one of the following options:
- Concatenate Date and Time to the file name.
- Export now or Schedule and Subscribe to the export.
-
Select Export Now or Schedule.
Send Report in Email
The Send Email action in Workflows/Automation supports Pixel-Perfect Reports. It currently supports one report per email action. You can add other types of attachments (files, chart exports, and dashboard exports) to the same action. The email is sent to the address of the user ID in the widget or the logged in user.
For more information, see the "Send an Email" section of Send Actions.
Embed a Report
The Pixel-Perfect Reports widget enables you to embed this feature into applications. For more information, see Pixel-Perfect Reports Widget.
Filter Data
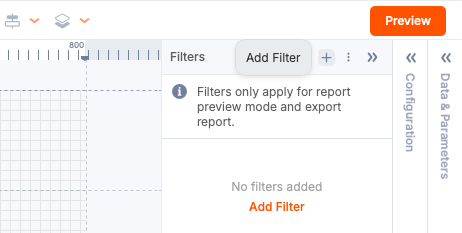
Filters enable you to refine the data that is displayed in the reports. Filters in Pixel-Perfect Reports are configured similar to Filters in Qrvey Composer. The only difference is that filters in Pixel-Perfect Reports are not applied while the canvas is in Edit mode. The filters are applied when you preview a report.
To create a filter, display the Filters panel and select Add Filter.
For more information on configuring filters, see Introduction to Filters.
Bucket Data
Pixel-Perfect Reports enables you to create buckets in your reports and add them to your report’s dataset. Buckets can improve the ability to analyze data by grouping multiple data points into a single item. The report must have an associated dataset in order to create a bucket. After you have created a bucket, it is linked to the dataset in which it was created, and it is available in all reports using that same dataset.
To create a bucket, select the Bucket icon in the toolbar.
![]()
For more information on creating buckets, see Bucketing Data.
Formulas
Pixel-Perfect Reports support the use of Formulas to manipulate data from the report’s dataset.
To create a formula, select the Formula icon in the toolbar.